Funnel metrics drive every decision in a direct response funnel. It is a numbers game.
The game is won through A/B testing.
A/B testing is often the only thing between a million dollar funnel and a flop.
The difference between the two, comes down to the numbers.
However, the numbers on the front-end don’t need to all be big to have a multi-million dollar business.
But they do have to dialed in, through A/B testing.
A multi-million dollar funnel does not need a 2% or even a 1% front-end conversion rate in order to crush it.
Let’s take a look at some funnel metrics with a 0.8% conversion rate and break it down.
Monthly Funnel Metrics:
Ad Spend
Visits
Conversion Rate
Buyers
$5,000
10,000
0.80%
80
Here’s how the numbers work.
In this example, you’re driving 10,000 visits to your funnel per month with a conversion rate of 0.8%
That means, you’re getting 80 new buyers added to your business each month with this funnel.
To understand your funnel metrics, we’ll first calculate how much it costs you to get each new funnel buyer. That’s your cost per acquisition or CPA.
CPA is calculated by dividing your ad spend, $5,000 (what you spend on ads to get those 10,000 visitors) by the total number of people that bought your front-end offer, (which are those conversions, i.e. your buyers).
Total Ad Spend / Total # of Buyers = CPA
5,000 / 80 = 62.50
In other words, you’re paying $62.50 for each new buyer.
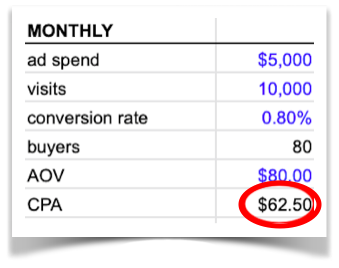
That’s your CPA (cost per acquisition.) It’s the price you’re buying a customer for.
But is a $62.50 cost per buyer good or bad?
It depends on other numbers in your funnel. (Never compare that to what someone else is spending, their funnel metrics are different.)
Let’s go further into your funnel metrics and look at…
Funnel Metric:Return on Ad Spend
Return on ad spend (ROAS) is the money you get back on what you spent on ads to bring traffic to your funnel.
You’ll need to know both average order value (AOV) and cost per acquisition (CPA) to calculate return on ad spend.
You already know your CPA is $62.50
Your average order value (AOV) is the total revenue the funnel generated, including up sells, etc. divided by the total number of front-end sales.
In this funnel your AOV is $80
Now that you have your average order value, you can calculate your return on ad spend.
ROAS = (AOV – CPA) / CPA
(80 – 62.50) / 62.50 = .28
In this example, your return on ad spend (ROAS) is 28%
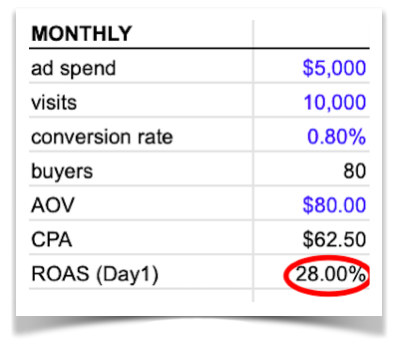
What that means is that you’re getting 28% of your ad spend back each month.
Looking at that another way… You’re getting a zero interest loan for 28% of your ad budget every month from Google, Facebook or wherever you’re running traffic, to fund the growth of your business. The growth gets buyers into your business in order to convert them on a second, third, and fourth sale. That’s your backend.
If you could afford to spend more money then you can get more buyers. The more buyers you can get the faster your business will grow.
The closer you can get to a 1 to 1 ratio, that is a 100% ROAS, the more you can afford to spend to bring in buyers.
Where most people mess up is not looking at the life time value (LTV) of your customers. It’s very important to factor in LTV into your funnel metrics.
Since these are new buyers you will need to make assumptions for their LTV based on older buyers.
Let’s say, from past data, that your average customer LTV is $300.
That would mean your return on LTV for this funnel is 380%
Funnel LTV = (Average LTV – CPA) / CPA
(300 – 62.50) / 62.50 = 380%
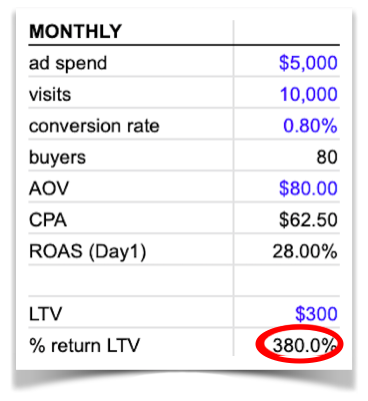
This is the backend of your business, everything you sell them after the they leave your funnel.
If those new buyers are worth as much as your current average customer LTV of $300, then you’re printing money on the backend once you’ve bought each of them for $62.50.
So $62.50 is a great cost per acquisition for this funnel. In fact you can afford to spend even more to get each new buyer…
Even, if your conversion rate is much lower.
Let’s say your conversion rate is 0.35% which would raise your CPA to $143.
Your return on LTV is still pretty healthy at 110%
As you can now see, funnel metrics are hinged on just two levers.
- Conversion rate
- Average order value
Each funnel needs to be dialed in to make them work, no funnel right out of the gate is a winner. There’s an art and a science to funnel metrics.
So, let’s look at each lever individually.
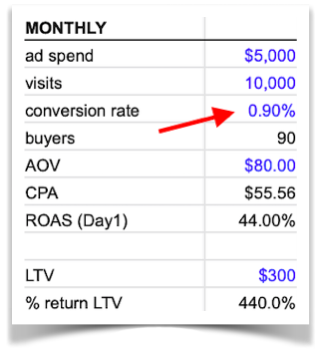
Funnel Metric: Raising The Conversion Rate Lever
Let’s say through conversion rate optimization (A/B Testing) you increase your conversion rate by 12%. That would take your conversion rate from 0.8% to 0.9%. It’s still under 1% but it makes a dramatic impact on the overall numbers.
That slight increase in sales conversion rate to 0.9% raises your return on ad spend (ROAS) from 28% to 44%.
You’re now getting almost half the ad spend back each month. Because you’re getting more buyers.
Raising your sales conversion rate great. But there’s another way to come at better funnel metrics and that’s through the other lever.
Funnel Metric:Raising The Average Order Value Lever
Average order value is the second biggest lever that you can immediately impact. It is the second biggest lever because if you don’t have any front-end conversions coming in than your AOV is not going to matter.
If your funnel is not making enough revenue from each customer then your ability to scale is dead in the water. No matter how good your sales conversion rate is.
Your funnel metrics may not work at all if your AOV is as low as $2, even with a 3% conversion rate. Remember the metrics of each funnel is different, which is why you can’t just look at conversion rate as the only indicator.
If each new customer only spends $29, but it costs you $59 to get each new customer, converting more customers means you lose money quicker. Unless you can weather the short term losses and make it up in the long term on the backend. Not everyone is equipped to play and win this cash flow game.
But let’s get back to the average order value lever. If you get a better upsell take rate, or make more money on the upsell flow you can raise your AOV.
Sometimes the sensitivity of funnel metrics is so slight that a $2 – $3 AOV increase can totally turn around a failing funnel.
But in this example, let’s say you raised your AOV to $120.
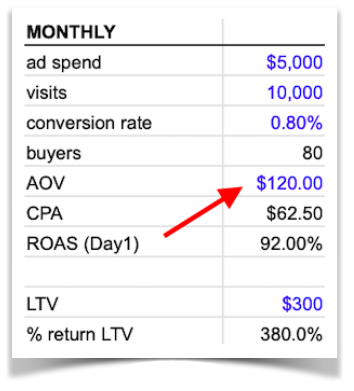
That jumps your return on ad spend to 92% on the same 80 buyers. That is if you didn’t raise your sales conversion rate and it stayed 0.8%.
The return is higher because you’re making more money on each buyer. That closes the gap of ROAS (return on ad spend) almost getting to a 100% return. Where every dollar you put in you get back. Remember if you can get to a 100% ROAS, you have a funnel that can virtually print money.
Discover the 3 funnels that can help your health supplement business succeed.
Listen to the Health Supplement Business Mastery Podcast for for dietary supplement entrepreneurs and marketers.